
TTLatency: Difference between revisions
| Line 13: | Line 13: | ||
Here are some example graphs from our line monitoring. The latency is shown as the blue line at the base of the graph, and a change is shown as it increasing or decreasing by a few pixels. |
Here are some example graphs from our line monitoring. The latency is shown as the blue line at the base of the graph, and a change is shown as it increasing or decreasing by a few pixels. |
||
<gallery mode=" |
<gallery mode="packed-hover" widths="1005" caption="Example graphs showing latency jumps"> |
||
TTLatency1.png|Jump down at 9am |
TTLatency1.png|Jump down at 9am |
||
TTLatency2.png|Jump down at 8pm |
TTLatency2.png|Jump down at 8pm |
||
Revision as of 12:44, 4 April 2017
Timeline
2017-04-07 - Page created showing examples and giving a brief description of the problem.
Introduction
We see latency jumps of about 3-5ms on some TalkTalk connected lines after a re-connection.
Purpose of this page
This page will be updated with information about the issue, we will also open a Status page to go along side this page.
Examples:
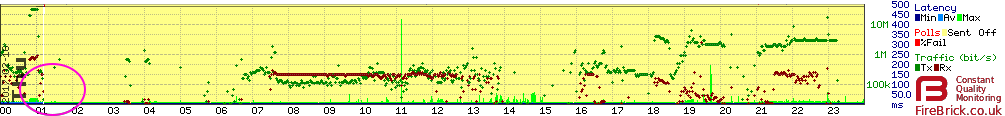
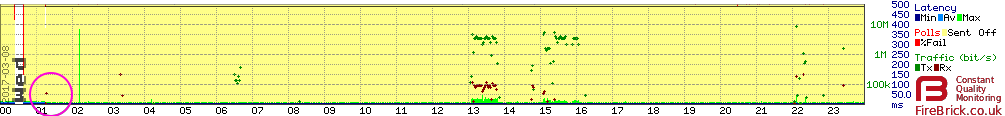
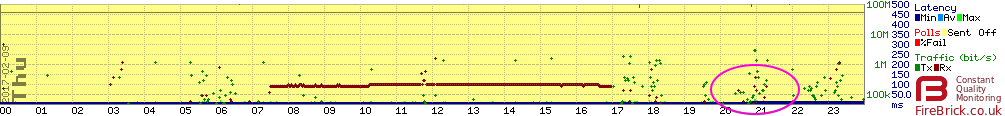
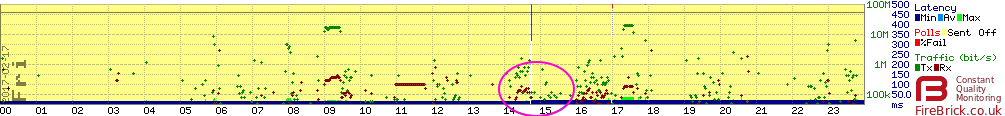
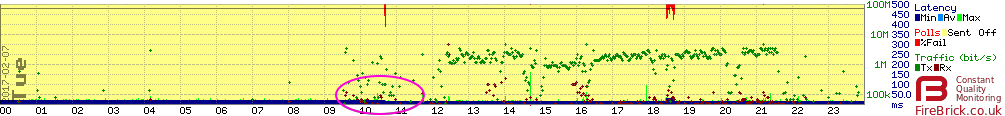
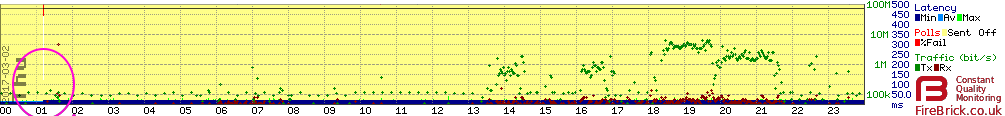
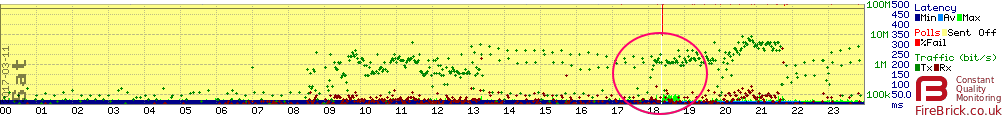
Here are some example graphs from our line monitoring. The latency is shown as the blue line at the base of the graph, and a change is shown as it increasing or decreasing by a few pixels.
- Example graphs showing latency jumps
-
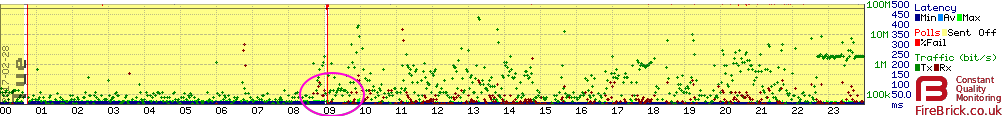 Jump down at 9am
 -
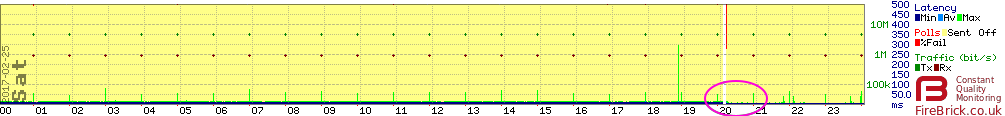 Jump down at 8pm
 -
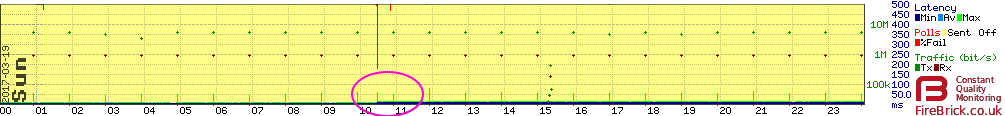 Jump up at 10am
 -
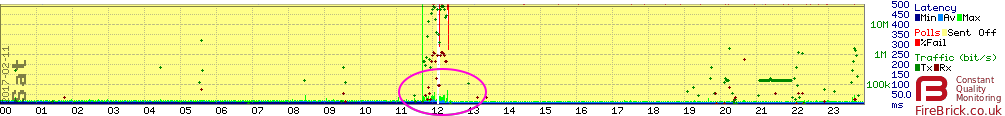 Jump down at noon
 -
 Jump down at 1am
 -
 Jump down at 1am
 -
 Jump up at 9pm
 -
 Jump up at 3pm
 -
 Jump down at 10:30am
 -
 Jump up at 1am
 -
 Jump down at 6pm


How does this affect customers?
The impact is usually low or zero. A few extra milliseconds is not noticed in practice by most customers, it's not enough to impact the majority of services, VoIP will still work unaffected etc.
It is noticeable on the graphs and has understandably been questioned by a number of customers.
When does this happen?
This typically happens when a lines is moved between LNSs at our side the latency may jump.
Why does this happen?
In simple terms, TalkTalk run a ring network, and traffic and go around it one of two ways. One direction is shorter and the other longer - hence if your circuit is being routed on the longer path, then the latency will be higher.
What can be done?
We don't have any control over the route your circuit will take, so in some ways it it pot luck as to which path you are on. However, TalkTalk are wanting to improve this and we are working with them on this project.